
A shopper in Chicago fills a cart, taps Apple Pay, and gets a red banner. Card declined. She shrugs and buys it somewhere else before dinner.
Monday, two teams review that Sunday. The conversion team sees checkout completion down and queues a test on how shipping costs display. The payments team sees a small approval dip in one BIN range and files it as noise. Both dashboards work exactly as built. Neither one contains the sale.
That seam is where most enterprise checkout conversion goes. And it has been open a long time.
Baymard Institute puts the average documented cart abandonment rate at 70.22%, calculated across 50 studies and last updated in September 2025. The oldest study in that set is from 2006. The average has held through mobile commerce, one-page checkouts, guest checkout and every design pattern the industry has shipped since.
Some of it is untouchable. 42% of US shoppers told Baymard they abandoned because they were browsing, not buying. The rest is worth real money: Baymard estimates the average large e-commerce site could gain a 35.26% increase in conversion rate by fixing documented checkout usability issues, roughly $260 billion in recoverable orders across the US and EU.
That figure gets quoted constantly. Where it stops is the more interesting part.
Baymard ranks why shoppers leave, once browsing intent is removed. Extra costs lead at 40%, slow delivery at 20%, distrust of the site with card details at 19%, forced account creation at 18%, and a checkout that felt too long at 17%. Every one of those is a design brief, and the brief is legitimate: the average US checkout displays 23.48 form elements by default, where Baymard's testing suggests 12 to 14 is enough.
Then the list keeps going. 10% abandoned because the card was declined. 9% because there were not enough payment methods.
Together that is close to a fifth of recoverable abandonment, and it is the only part of the list no designer can touch. A seven-field form still will not approve a declined card.
That 9% counts shoppers who wanted to pay and could not find a way they trusted.
Worldpay's 2026 Global Payments Report, built on more than 63,000 consumers across 42 markets, found digital wallets reached 56% of global e-commerce transaction value in 2025. In the US, wallets took 40% of online value, ahead of credit cards at 32%. Buy now, pay later held 6% and is forecast to grow 13% annually through 2030.
Knowing that takes an afternoon of reading. Operating it takes quarters, because every provider reports in its own format with its own decline codes.
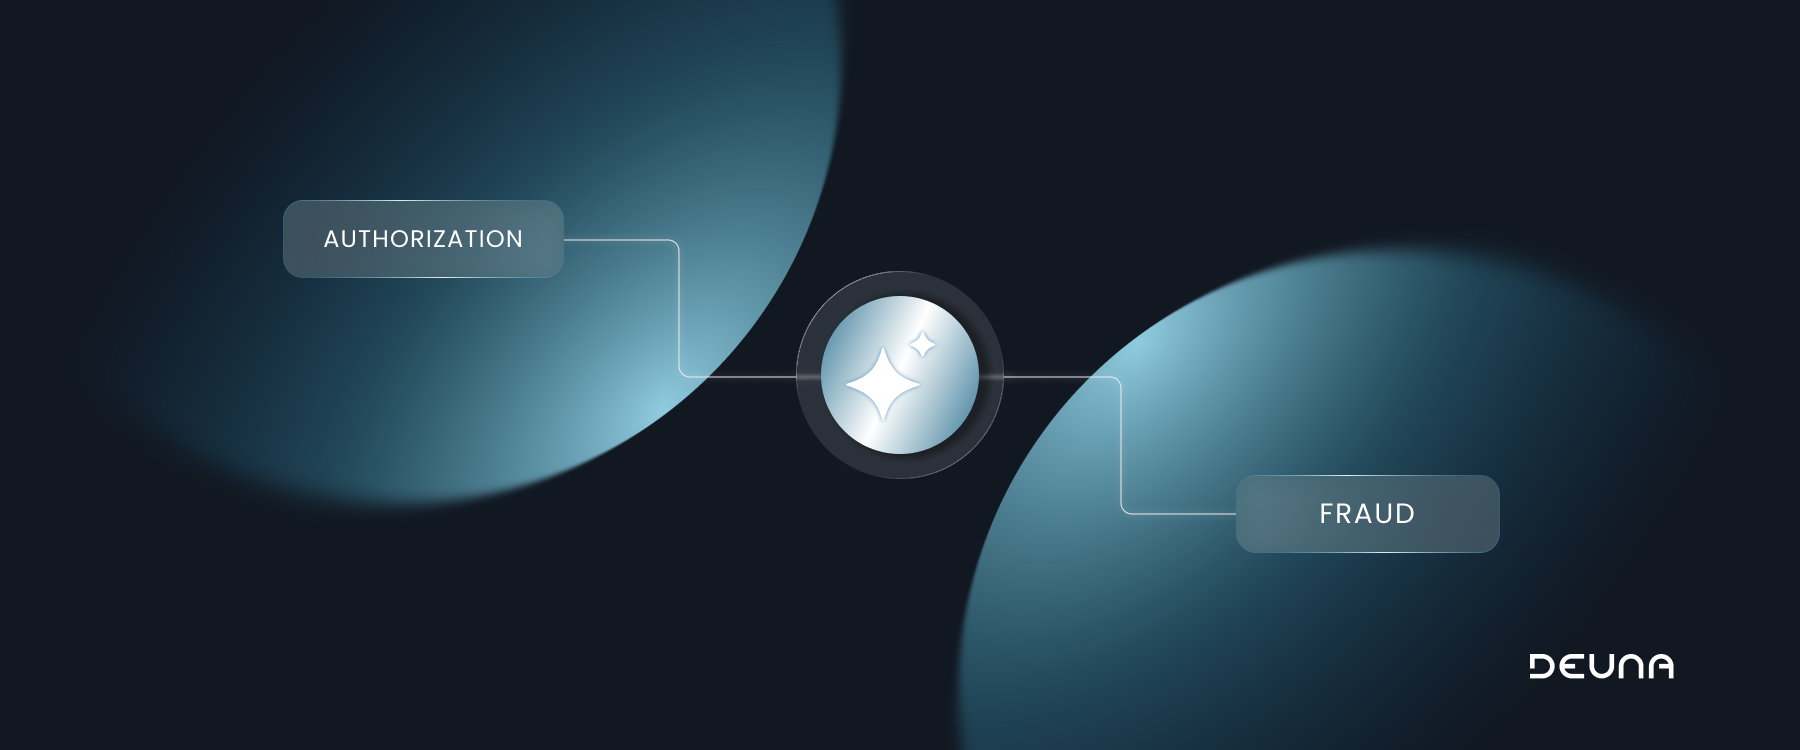
Which is why those two dashboards never reconcile. Without a common view, nobody can tell whether approvals slipped because an issuer changed policy, a fraud rule drifted strict, or a provider degraded during peak.
The pressure to keep those rules tight is not imaginary. The Merchant Risk Council's 2026 report, produced with Visa Acceptance Solutions and Verifi from 1,278 merchant professionals across 37 countries, found 3.2% of annual e-commerce revenue lost to fraud globally. Teams tune defensively against that number. The shopper caught in the crossfire never files a complaint. She just leaves.
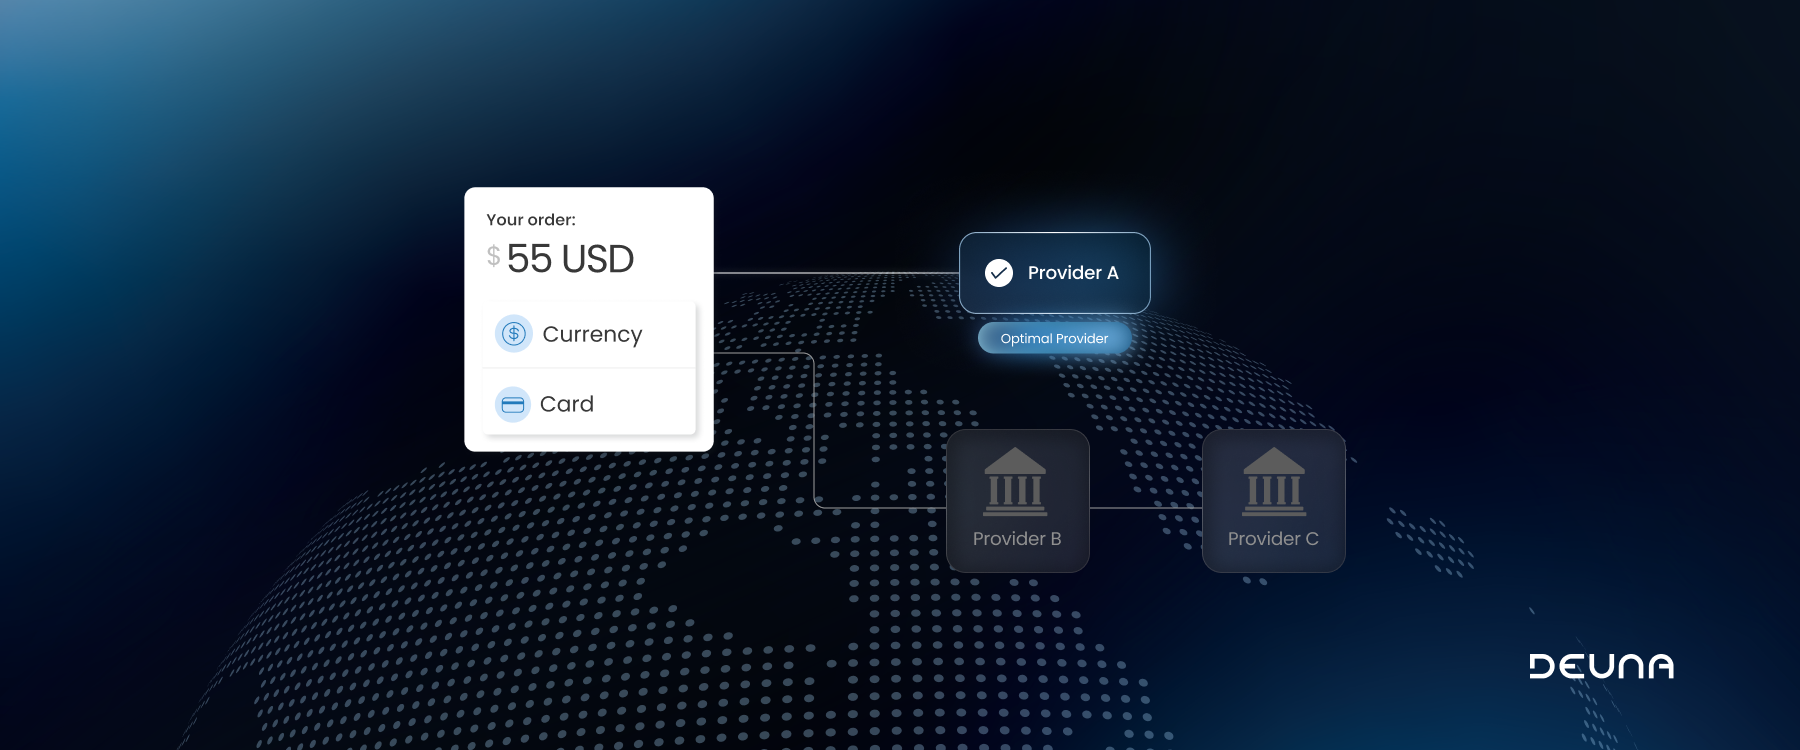
DEUNA sits alongside the PSPs, acquirers and fraud engines already in place, connecting them through one integration to more than 400 payment providers, antifraud tools and local payment methods. Adding a wallet in a new market becomes a configuration change instead of a roadmap item. Athia reads performance continuously and surfaces where acceptance is slipping and which move recovers the most, while the revenue is still recoverable.
Checkout conversion has two halves. Most enterprises staff, test and report on one of them. The other gets treated as plumbing, which means it gets treated as somebody else's, which means it gets treated as nobody's.
Every merchant that has closed the gap started the same unglamorous way: they put the design funnel and the authorization funnel in front of the same people and asked the question that had never had an owner. Between the tap and the confirmation, what are we losing?
That revenue is already sitting inside traffic you paid to acquire. Talk to DEUNA about how much of it comes back.